Ocean Ecosystem and Resources : Characterizing the Mid-Atlantic Ocean Ecosystem
Living Marine Resources
The Mid-Atlantic ocean has a wide variety of habitats that host a diversity of mammals, fish, invertebrates, birds, and other species. Habitats range from shallow coastal bays with seagrass beds where young fish find refuge to deep offshore canyons where clusters of cold-water corals shelter species such as tautog and black sea bass. Species’ ranges overlap in the Mid-Atlantic, which serves as the southern boundary for a number of cold-water species and as the northern boundary for some warm-water species. Some marine mammals, sea turtles, and fish use the Mid-Atlantic ocean year round, while others pass through on their annual migrations. A wide diversity of birds, such as scoters, gannets, petrels and shearwaters, are residents or migratory visitors.
New Studies Reveal Patterns of Marine Life
Mid-Atlantic Baseline Studies Project
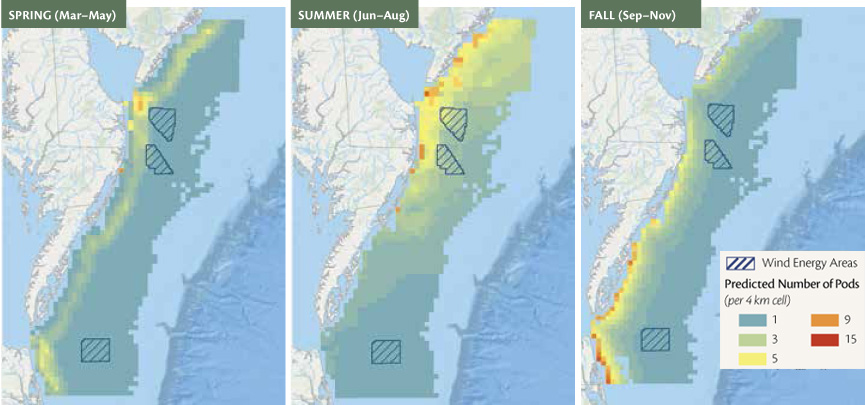
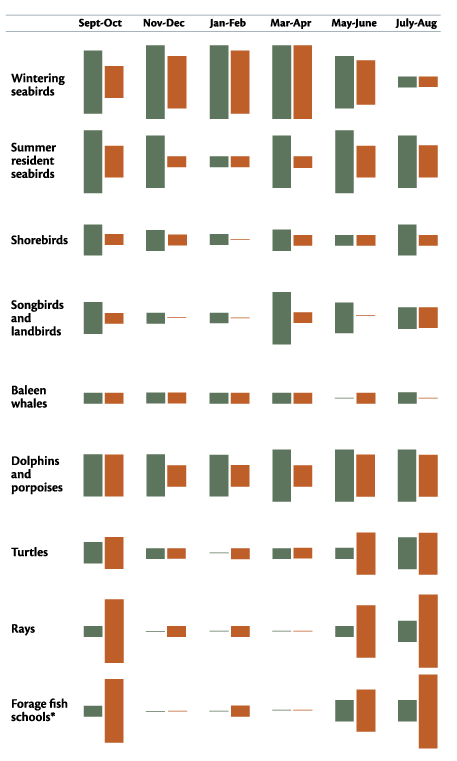
Funded by the Department of Energy (DOE), the Mid-Atlantic Baseline Studies Project investigated wildlife distributions, abundance, and movements between 2012 and 2014. The study focused on a portion of the Mid-Atlantic region (offshore of Delaware, Maryland, and Virginia) that is considered likely to be developed for wind energy. The researchers found hotspots of wildlife abundance and diversity in areas offshore of the mouths of Chesapeake and Delaware Bays, and south of Delaware Bay along the coast. Across the study area, they also documented considerable seasonal variation in which species were present and where they were most abundant.
Example of seasonal changes in species distribution. Predicted numbers of bottlenose dolphin pods by season, based on two years of boat surveys (2012-2014) conducted offshore of Delaware, Maryland, and Virginia. (Source: Williams et al. 2015)
Temporal changes in relative abundance for major taxonomic groups. Data are from boat-based surveys (green) and high-resolution digital video aerial surveys (brown) conducted in 2012-2014. (Source: Williams et al. 2015)
Biogeographic Assessment of New York Bight
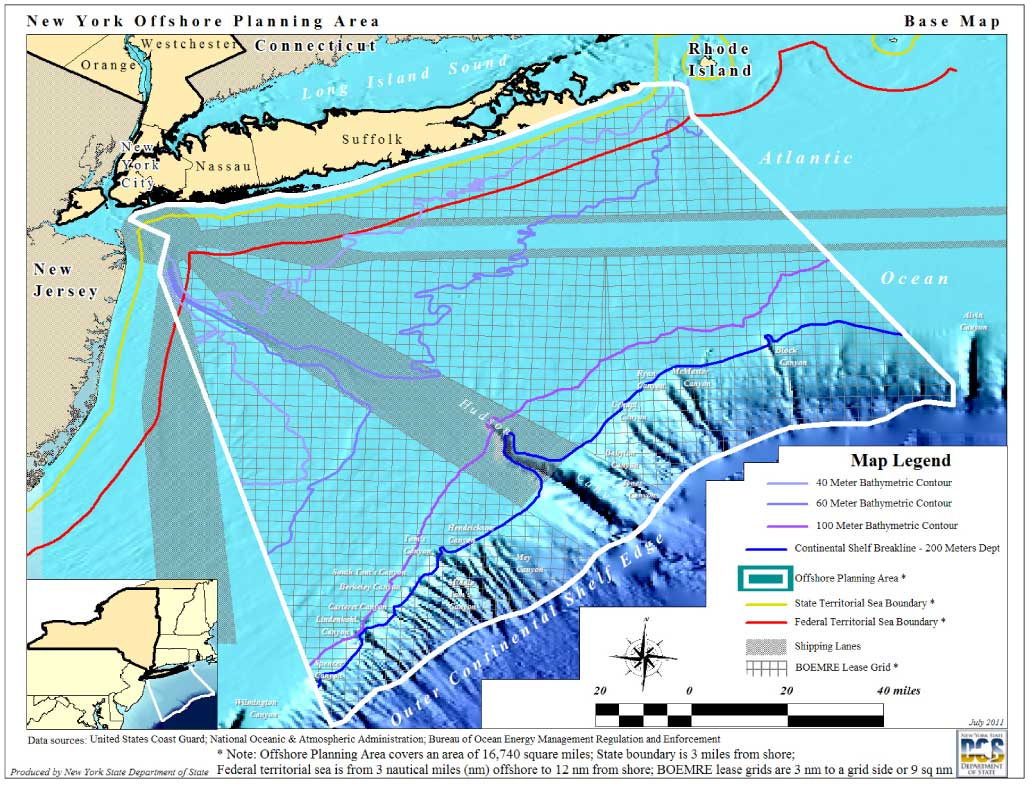
A study conducted by the NOAA National Centers for Coastal
Ocean Science provides a compilation of maps and spatial assessments of bathymetry, surficial sediments, oceanographic habitat variables, deep sea corals, and seabirds for offshore waters of New York. The report is helping New York to balance ocean uses and environmental conservation in the state’s waters.
Marine Life Data and Analysis Project
The Mid-Atlantic Regional Council on the Ocean sponsored a project in 2015-2016 to characterize marine life distribution and abundance in the Mid-Atlantic ocean. Because of the ecological connectivity between adjacent regions, this project coordinated closely with similar efforts to characterize marine life in the Northeast region.
As a result of this project, the Marine Life Data Analysis Team (MDAT, a team of scientists from Duke University, NOAA, and Loyola University) has compiled information on the distribution and abundance of 29 marine mammal, 40 bird, and 82 fish species, and has developed a “virtual reference library” of maps.
Maps for marine mammals and birds were developed using modeling frameworks that use marine life observations and environmental variables (such as depth, seafloor slope, and sea surface temperature) to predict species density across the study area. The scientists at Duke developed a story map to explain the marine mammal modeling framework. A similar framework was used to model bird relative abundance and occurrence. The marine mammal model outputs have a 10-kilometer (6.2-mile) grid size, and the bird model outputs have a 2-kilometer (1.2-mile) grid size.
Maps for fish were developed by mapping the results for each of two different trawl surveys — one conducted by the Northeast Area Monitoring and Assessment Program (NEAMAP) and one by the NOAA Northeast Fisheries Science Center (NEFSC). The resulting maps show biomass for fish species at each sampling location as well as mean biomass summarized on a 10-kilometer grid. The NEAMAP dataset contains surveys from 2007-2014, whereas the NEFSC data spans 1970-2014.
MDAT’s summary aggregate products derived from species base layers have resulted in maps useful for regional ocean planning. These summary maps show the total abundance, diversity, and species richness of groups of species such as “coastal waterfowl” and “diadromous fish”.
The new maps generated by MDAT will be useful for understanding where and when different species are most abundant in the Mid-Atlantic. The maps can also be used to help identify areas that host a high diversity of species. Combined with other data, MDAT products may be used in identifying potential ecological rich areas for ocean planning in the Mid-Atlantic.
In this webinar recorded by the Mid-Atlantic Ocean Data Portal, Patrick Halpin of the Duke University Geospatial Ecology Lab shares his insights on the Marine Life Data Analysis Team (MDAT) effort.


